
Whether you’re trading individual stocks on the Nasdaq or its indices, having a reliable approach for how to analyze a stock before buying can make or break your success.
Proper Nasdaq technical analysis helps you uncover winning opportunities on a consistent basis while informing your buy and sell decisions and timing your trades to perfection.
That’s why we’ve compiled this guide on how to do technical analysis of stocks on the Nasdaq. We’ll guide you through the best technical indicators for stock trading, from moving averages to the RSI, chart patterns, volume analysis, and more.
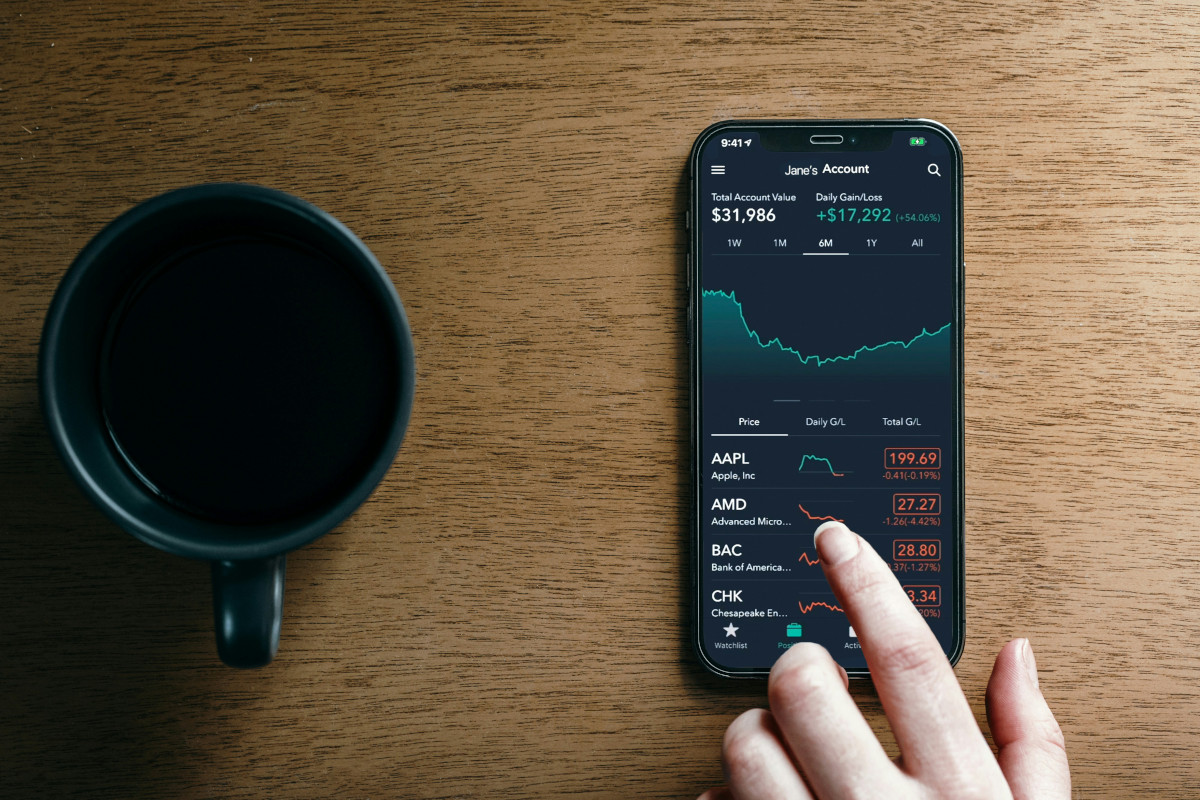
The truth is, though, you don’t need to waste your time filtering through complex technical data. You can leverage our stock software to win more trades with less work, as we get our insights directly from the Nasdaq. That means you’re getting the most accurate, up-to-date information.
You’re given a buy, sell, or hold recommendation for any given stock at any given time. See how it works by getting a stock analysis free today and transform your trading strategy for the better!
Overview of the Nasdaq
The Nasdaq is a global electronic marketplace for buying and selling securities. It was founded by the National Association of Securities Dealers (NASD) and began operations on February 8, 1971. As the world’s first electronic stock market, it marked a key milestone in the evolution of global financial markets.
Today, it’s the most active stock exchange in the US by volume, comprised of two unique tiers: the Nasdaq Global Select Market and the Nasdaq Capital Market.
The Global Select Market includes large, high-profile companies with stringent financial and liquidity requirements. The Capital Market, on the other hand, caters to smaller, emerging companies that meet less rigorous listing standards.
Nasdaq is home to over 3,300 listed companies from a wide array of industries, although it’s known for its high concentration of tech companies. For this reason, it’s often used as a barometer for tech sector performance. Industry leaders like Apple, Microsoft, Amazon, and Alphabet (Google’s parent company) are all listed on Nasdaq.
You may be more familiar with the Nasdaq for its indices than the individual stocks it features. There are two particularly prominent indices you need to be aware of:
- Nasdaq Composite Index: Includes almost all stocks listed on the Nasdaq stock market. It’s a broad-based index that provides a comprehensive snapshot of the market’s performance. It’s highly regarded as a way to gauge the health and trends within the technology sector, given its heavy weighting toward tech stocks.
- Nasdaq-100 Index: 100 of the largest non-financial companies listed on the Nasdaq stock market. It’s known for its high volatility. Companies in this index are leaders in fields like technology, telecommunications, biotechnology, and retail.
Whether you’re trading these indices or trying to learn how to build a stock portfolio composed of individual companies on the Nasdaq, technical analysis is going to be a key component of your stock investment strategy. Let’s explain why…
Why Nasdaq Technical Analysis is So Important
What is technical analysis of stocks in the first place? This is a means of taking complex technical data and distilling it down into more clear, actionable takeaways. The goal is to forecast price movements to guide buy and sell decisions.
In saying that, Nasdaq technical analysis is going to help you find opportunities and execute them with precision, helping you earn higher returns while mitigating losses.
Identifying Key Price Levels
Technical analysis tools, such as support and resistance levels, are invaluable in identifying key price points where stocks might reverse direction or break out to new levels.
Nasdaq stocks often experience significant price swings. So, knowing these levels can help you set entry and exit points to maximize profits and minimize risk.
Assessing Market Sentiment
What is market sentiment, you ask? Simply put, it’s a way to gauge how other investors and experts feel about a given stock, segment, or the market as a whole.
There are a number of ways you can analyze market sentiment of the Nasdaq itself or specific stocks on it. These include moving averages, relative strength index (RSI), and MACD (Moving Average Convergence Divergence) – all of which we’ll explain later on.
Each of these helps you get a better idea of whether the market is overbought or oversold, indicating potential reversals or continuations of trends.
Timing Trades
Perhaps the most important reason to learn about Nasdaq technical analysis is so you can time your trades to perfection. Predicting future price movements empowers you to enter your position as a stock begins its upswing and exit it just as the downswing begins.
We know what you’re thinking…does market timing work? After all, market timing strategies sound too good to be true. But, market timing indicators are just another piece of the technical analysis puzzle. You can use our stock market analysis app to time your trades with ease.
Risk Management
It’s not just about maximizing your profit potential, but protecting yourself from downside exposure as well.
Analyzing the Nasdaq also involves watching for potential reversals and setting stop losses accordingly. This is an essential component in any investment strategy, but especially one centered around the Nasdaq given its volatility.
Tips on Performing Technical Analysis for Nasdaq Stocks or Indices
Now, how does technical analysis work? With the VectorVest stock software it’s simple and straightforward – just follow the system’s clear buy, sell, or hold recommendation for any given stock at any given time and win more trades with less work!
That being said, you should still learn technical analysis of stocks the old-fashioned way. If for no other reason, you’ll get a whole new appreciation for how much time and stress investing apps for beginners can save you. So, we’ll walk you through using a variety of indicators, chart patterns, volume analysis, and more below.
Utilizing Key Indicators
There are a wide variety of technical indicators you’ll use to analyze stocks, including:
- Moving Averages: These smooth out price data to create a single flowing line for easier identification of a trend’s direction. The two most common types are the Simple Moving Average (SMA) and the Exponential Moving Average (EMA). 50-day and 200-day moving averages are particularly popular for identifying long-term trends and potential reversal points.
- Relative Strength Index (RSI): Measures the speed and change of price movements on a range from 0 to 100, helping identify overbought or oversold conditions so you can enter or exit a position to perfection. An RSI above 70 indicates overbought conditions, while an RSI below 30 indicates oversold conditions.
- Moving Average Convergence Divergence (MACD): A trend-following momentum indicator that shows the relationship between two moving averages of a stock’s price. The MACD line is the difference between the 26-day and 12-day EMAs, while the signal line is the 9-day EMA of the MACD line.
Chart Patterns
You can also just pull up a stock chart and look for key trading patterns to help you through Nasdaq technical analysis. Some of the most common patterns include:
- Head and Shoulders: Indicates a potential trend reversal. It consists of three peaks: a higher peak (the head) between two lower peaks (the shoulders). A neckline is drawn by connecting the lows of the two troughs – the price breaking through signals a bearish reversal.
- Double Tops and Bottoms: Signifies potential reversal points. A double top is formed after a strong upward movement, indicating resistance and a potential downward reversal. Conversely, a double bottom forms after a downward movement, indicating support and a potential upward reversal.
- Triangles: These can be ascending, descending, or symmetrical. They form when the price converges with a trendline resistance or support, indicating a potential breakout in either direction. Ascending triangles suggest a bullish breakout, descending triangles suggest a bearish breakout, and symmetrical triangles can break out in either direction.
Volume Analysis
Volume analysis assesses the number of shares traded during a particular period. High volume confirms trends, while low volume may indicate a lack of conviction. For example, a price increase on high volume is more likely to continue than a price increase on low volume.
You can also watch out for spikes in volume to inform your decision-making. Sudden volume increases can signal the beginning of a new trend or the end of an existing one. Spikes often occur at the start of a new move or during the climax of a trend, indicating strong buying or selling pressure.
Take note of volume and price divergences, too, as this can signal a potential reversal. For instance, if the price is rising but volume is falling, the upward trend may be losing momentum.
Combining With Fundamental Analysis
We know you came here specifically to learn about Nasdaq technical analysis, but learning how to combine fundamental and technical analysis is even more important. After all, technical analysis doesn’t always paint the full picture.
So, pay attention to company earnings reports for insights into financial health and future prospects. Earnings surprises, either positive or negative, can drive prices up or down.
Similarly, you should stay abreast of macroeconomic factors like interest rates, inflation, and employment data. These things can influence market sentiment and subsequently, stock prices.
Understanding the broader industry context can enhance technical analysis as well. For instance, trends in the technology sector, regulatory changes, or advancements in innovation can affect Nasdaq stocks.
You can learn more about fundamental vs technical analysis or how to pick a stock in general in our blog. But why work harder when you could work smarter with the VectorVest stock advisory?
Streamline Your Efforts and Maximize Your Profits With the #1 Nasdaq Technical Analysis Software: VectorVest!
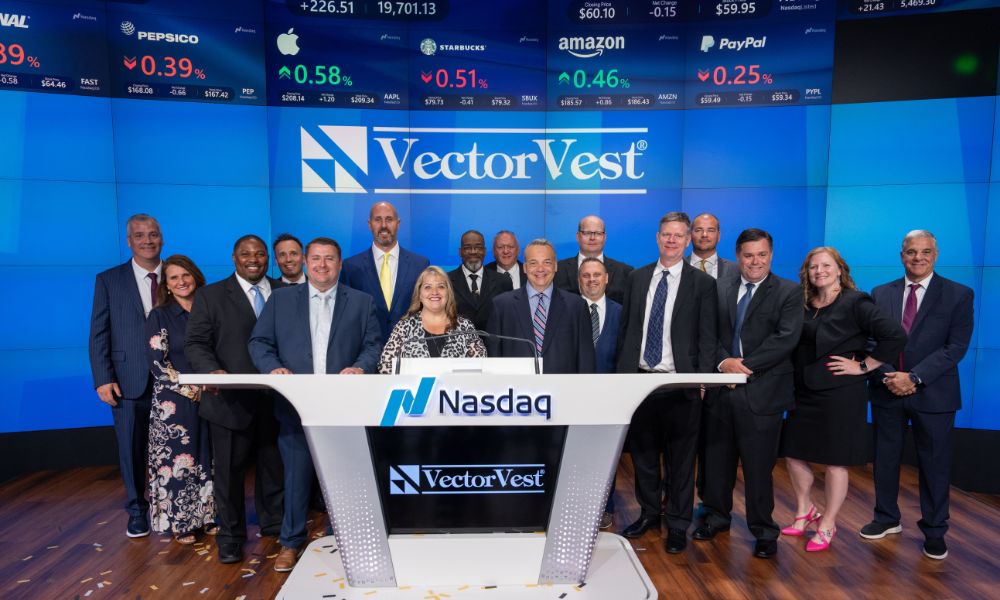
VectorVest has outperformed the S&P 500 index by 10x over the past 20 years and counting, and it’s only getting better now that it pulls data directly from the Nasdaq.
This means if you’re trading stocks on the Nasdaq or even its indices, you have access to the most accurate, up-to-date information for making buy and sell decisions. But it’s not just about data quality, it’s about the way you’re fed essential information.
The system takes complex technical data and distills it into clear, actionable insights. Rather than spending hours analyzing charts or tracking technical indicators, you can simply rely on 3 ratings: relative value (RV), relative safety (RS), and relative timing (RT).
Each sits on a scale of 0.00-2.00 with 1.00 being the average, making interpretation quick and easy. Just pick safe, undervalued stocks rising in price to win more trades with less work!
It gets even easier, too. You’re given a buy, sell, or hold recommendation for any given stock at any given time based on its overall VST rating, completely eliminating guesswork or human error from your trading strategy.
Plus, you never have to look far for your next trade thanks to the best stock picking app. You have a variety of proprietary screeners at your fingertips whether you’re wondering how to find undervalued stocks or looking for falling stocks to buy, aggressive stocks to buy now, the most volatile stocks today, or even the best stocks for beginners.
Given the importance of Nasdaq technical analysis, don’t take any chances with free stock analysis websites. Simplify your stock analysis process and earn higher returns with less work and stress. Try VectorVest today and see firsthand how it can elevate your strategy!
Bringing Our Nasdaq Technical Analysis Guide to a Close
Being able to analyze stocks on the Nasdaq or even indices can be the difference between profit and loss. You need a reliable, repeatable means of finding opportunities, mapping out your entry and exit, and executing accordingly. VectorVest provides exactly that.
Whether you’re looking for the best iPhone stock apps or the best Android stock apps, you won’t find a better option than VectorVest when it comes to Nasdaq technical analysis. After all, nothing else on the market has access to this exclusive data and provides it in the way we do!
So, leverage our cutting-edge tools to streamline your technical analysis and achieve better investment outcomes with less work. Make informed decisions with the most accurate and up-to-date market data today!


Leave A Comment