
There are so many different stocks you can invest in as you begin building a stock portfolio – VectorVest tracks more than 16,000 of them! Yet, those listed on the Nasdaq are among the most exciting opportunities.
These represent the highest-performance companies from the tech sector along with businesses from healthcare, consumer goods & services, and more. In saying that, you’re investing in reliable, established companies.
So, learn how to trade Nasdaq below, whether you decide to invest in individual stocks or one of the Nasdaq indices. We’ll cover developing a trading plan, opening a brokerage account, analyzing opportunities, executing trades, and more.
The first thing you should do, though, is get set up with our stock software. Because our data is derived directly from the Nasdaq you’re getting the most accurate, up-to-date information possible, helping you win more trades with less work and stress.
See VectorVest in action with a stock analysis free today!
What is the Nasdaq?
The Nasdaq (National Association of Securities Dealers Automated Quotations) is a global electronic marketplace for buying and selling securities.
It was established in 1971 as the world’s first electronic stock exchange, setting a new standard for financial transaction speed and transparency. While traditional stock exchanges rely on physical trading floors, the Nasdaq operates entirely electronically.
Nasdaq is known for its high concentration of technology and biotech companies, including giants like Apple, Microsoft, Amazon, and Google. The exchange lists more than 3,000 companies, making it one of the largest stock exchanges in the world by market capitalization.
However, it’s also home to the Nasdaq Composite, an index that tracks the performance of all the companies listed on the Nasdaq. This is a great way to get exposure to these companies without having to build your own stock portfolio for a more hands-off approach.
All that being said, why would you want to learn how to trade Nasdaq in the first place?
Why Trade the Nasdaq?
Of all the options at your fingertips trading the Nasdaq presents a few compelling advantages:
- High Liquidity: The electronic trading system ensures high liquidity so you can buy and sell shares quickly and easily. This helps achieve better prices for transactions and reduces the risk of price manipulation.
- Exposure to Innovation: Investing in Nasdaq-listed companies provides exposure to some of the most dynamic and aggressive stocks to buy now given its weighting in tech and biotech.
- Market Volatility and Opportunity: Its tech-heavy nature means it can be more volatile than other indices. While this carries higher risk, it also presents more opportunities for traders to profit from short-term price movements, particularly through swing trading strategies.
- Global Reach: Many Nasdaq-listed companies operate globally, exposing you to international markets and diversified revenue streams. This can help mitigate risk and empower you to capitalize on global economic trends.
- Advanced Trading Technology: The Nasdaq’s advanced technology ensures rapid trade execution while giving you access to sophisticated trading tools. Both individual and institutional investors use it to make informed trading decisions.
How to Trade Nasdaq: Step-by-Step Guide
Whether you’re looking for the most volatile stocks today or the best stocks for beginners, using the Nasdaq is a great option. So, let’s get into how to trade Nasdaq below to help you hit the ground running.
Determine Your Trading Strategy: Building Your Own Portfolio vs Buying Indices
There are two approaches you can take to trading the Nasdaq – building a portfolio based on the top-performing stocks within the Nasdaq or simply mirroring one of its indices.
There’s no right or wrong answer. It’s just a matter of whether you’re looking for a more hands-on or hands-off approach to investing.
For example, investing in Nasdaq index funds such as the QQQ ETF, which tracks the Nasdaq-100 Index, offers exposure to the largest non-financial companies listed on the Nasdaq. It’s diversified and managed by a professional so you don’t have to do anything.
However, you’ll lose control over the specific investments within the fund, which means you may be taking on unnecessary losses. You’ll also have fund management fees cutting into your returns.
In contrast, building your own portfolio with the top performers from the Nasdaq allows you to still remain diversified – but weed out the losers that would otherwise hold your portfolio back. You’ll also earn higher returns by avoiding fees associated with ETFs.
The drawback is that building and managing your own portfolio can be time-consuming and complex. That’s where VectorVest comes in. With the best stock picking app you can effortlessly trade individual stocks with less work and stress. More on that later.
Come up With a Trading Plan: Are You a Short or Long Term Trader?
You also need to determine what your goals are with trading the Nasdaq in order to come up with a plan. Are you looking to generate supplemental income for present-day expenses, or are you trying to prepare for retirement?
Maybe it’s a blend of both. Whatever the case, your goals will dictate the specific stock investment strategies you employ.
For example, those seeking short-term income can use either swing trading vs day trading as a means of capitalizing on short-term price movements. You’ll spend more time managing your portfolio and will focus more on technical analysis to inform your decision-making.
In contrast, if you’re trying to invest for early retirement you’ll want to look for blue chip dividend stocks, which are associated with established companies that have a proven track record of performance.
You’ll rely more on fundamental analysis, and while your returns won’t be quite as impressive in the short term, the compounding growth can be impressive over time.
Open a Brokerage Account: Top Choices for Where to Trade Nasdaq in 2024
Regardless of your chosen approach to investing, you’ll need to take the first step and open a brokerage account. This is where you’ll actually execute your trades.
We have a guide on the best broker for swing trading if you’re looking for a starting point. Some of the top options include Charles Schwab, TD Ameritrade, and Robinhood. The ideal choice will depend on your trading strategy and personal preference.
You’ll learn more about our stock advisory later on and the role it plays in helping you trade the Nasdaq, but consider using TradeStation, Questrade, or Interactive Brokers. Our software integrates with these options so you can analyze and execute trades all in one place!
Technical Analysis: Using Stock Indicators and Chart Patterns to Find and Execute Opportunities
You won’t need to conduct much analysis if you’re trading the Nasdaq through one of its indices – the professionals managing the fund have done all that for you. But if you’re trying to pick a stock to start building your portfolio, knowing how to do technical analysis of stocks is essential.
This will help you find entry and exit points for the stocks so you can give yourself room for profit. You’ll rely on the best technical indicators for stock trading to gain actionable insights, which include:
- Moving Averages: Help identify the overall trend by smoothing out price data over a specified period.
- Relative Strength Index (RSI): Measures the speed and change of price movements, indicating overbought or oversold conditions.
- MACD (Moving Average Convergence Divergence): Shows the relationship between two moving averages to identify bullish or bearish momentum.
You can also rely on chart patterns as a means of identifying trends and subsequent reversals. These will help you get into a stock at the perfect time and get out before the trend reverses, capturing profits and avoiding losses. We have a guide on the most common trading patterns to watch out for, but some of the easiest to use are:
- Head and Shoulders: Indicates a bullish-to-bearish trend reversal.
- Double Tops and Bottoms: Double tops indicate a bearish reversal, while double bottoms signal a bullish reversal.
- Triangles: Ascending, descending, and symmetrical triangles can indicate continuation patterns or potential breakout points.
You’ll want to rely on volume analysis to confirm the strength of a trend before you actually make any decisions. Increasing volume indicates a strong trend, while decreasing volume may signal a weakening trend.
Learning how to combine fundamental and technical analysis is especially important for long-term investors implementing a buy-and-hold strategy. But even if you’re only investing for short-term income, it’s worth using fundamental analysis.
Our blog has additional resources on how to analyze a stock before buying, including a comparison of fundamental vs technical analysis, how to find undervalued stocks, free stock analysis websites, and more.
While there’s a lot that goes into analysis, don’t sweat it too much. A solid grasp of these concepts is great, but you can simplify things with our stock market analysis app.
It takes these complex technical indicators and fundamental data and boils them down into more clear, actionable insights, saving you time and stress while helping you win more trades. More on that in a moment.
Monitor Your Positions: When to Take Profits or Cut Losses
While proper analysis helps you find your entry, actually exiting your position is where the profit is made. This is why monitoring your positions is so important.
You should establish specific price levels where you will take profits based on your analysis before even entering a position. This way emotion won’t get the best of you – you’ll always stick to your trading plan.
Better yet, remove yourself from the decision-making process entirely by setting trailing stop orders. These will protect gains by adjusting the stop price as the stock price moves in your favor. Should the price reverse, it’ll automatically close out your position for you.
As tough as it may be, knowing when to cut losses is essential to prevent costly portfolio blow-ups. You should always have a stop loss in place for every trade you make.
Again, this is something VectorVest can help with. ProfitLockerPro is a simple tool that tells you when to sell a stock to lock in profits or cut losses, thereby eliminating emotion, doubt, and regrets from your decision-making.
That being said, VectorVest is a comprehensive investing app for beginners and seasoned traders alike – it helps you find opportunities and execute them consistently. So, why work harder when you could work smarter?
Set Yourself Up for Success Trading the Nasdaq With VectorVest!
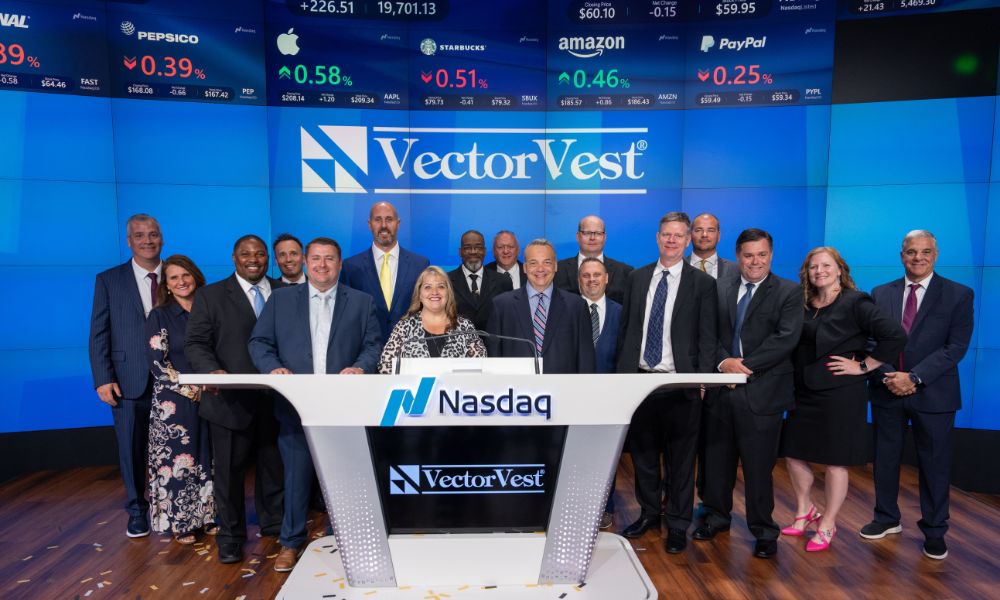
Our stock trading system pulls directly from Nasdaq’s last sales data (NLS). This means by using VectorVest you’re empowering yourself with the most accurate, up-to-date information.
This is great for any investor, but especially those interested in trading the Nasdaq or its indices. You won’t find higher-quality data to fuel your decisions than that of the source itself!
The system saves you time and stress while helping you win more trades by delivering clear, actionable insights in just 3 simple ratings:
- Relative value (RV): Compares a stock’s long-term price appreciation potential (forecasted 3 years out), AAA corporate bond rates, and risk. It’s a far superior indicator than the typical comparison of price to value alone.
- Relative safety (RS): A risk indicator computed from an analysis of the company’s financial consistency & predictability, debt-to-equity ratio, business longevity, sales volume, price volatility, and other factors.
- Relative timing (RT): Based on the direction, dynamics, and magnitude of the stock’s price movement. It’s calculated day over day, week over week, quarter over quarter, and year over year.
Each sits on a scale of 0.00-2.00 with 1.00 being the average, allowing for quick and easy interpretation. You’re also given a buy, sell, or hold recommendation for any given stock at any given time based on its overall VST rating.
Plus, you gain access to proprietary stock screeners that help you find opportunities on a daily basis. Whether you’re looking for falling stocks to buy or the best blue chip dividend stocks, the best day trading stocks, or anything in between, your next trade is a click away.
Set yourself up for success trading the Nasdaq with VectorVest. Experience unparalleled precision and accuracy in your trading strategy with the best iPhone stock app or the best Android stock app today.
Final Thoughts on How to Trade Nasdaq
There you have it – how to trade Nasdaq. This is a great way to start your investment journey because the companies listed on this exchange are among the most powerful in the world. You’re getting exposure to the top tech stocks and many other industry-leading businesses.
Still, there’s a lot that goes into this journey – from choosing your trading strategy to selecting the right brokerage and effectively monitoring your positions to maximize profits and minimize losses. That’s why we encourage you to leverage VectorVest to streamline your trading strategy.
Through our partnership with Nasdaq you’ll gain advanced analysis, real-time data, and comprehensive risk management features to help you trade Nasdaq stocks with confidence and efficiency. See how simple and effective it can be by taking the first step today!


Leave A Comment