
The stock market is a wild ride—full of endless possibilities. The key to thriving isn’t luck—it’s knowing how to evaluate stocks with confidence. Introducing Stock Analysis 101: Your Complete Guide to Evaluating Stocks, where we break down the essentials of stock analysis, from the basics to the tools that can transform your portfolio. Whether you’re a newbie sizing up your first trade or a seasoned trader refining your edge, this guide has you covered.
We’ll show you how to analyze any stock for free—up to three a day—with a system that simplifies the chaos. Ready to master the market? Let’s dive in.
What Is Stock Analysis?
Stock analysis is the art and science of digging into a stock to figure out what it’s worth, how it might perform, and whether it fits your goals. Think of it as your due diligence toolkit—helping you separate winners from duds before you put your hard-earned money on the line. At its core, it’s about answering two big questions: Is this stock a good opportunity? and When’s the right time to act?
There are two main flavors of stock analysis—fundamental and technical—each with its own lens on the market. Fundamental analysis zooms in on a company’s financial health, like earnings, revenue, and growth potential. Technical analysis, on the other hand, tracks price patterns and market trends to predict future moves. Together, they’re like a one-two punch for understanding stocks from every angle.
Why does this matter? Because investors like you need clarity in a sea of noise. With thousands of stocks out there, analysis is your filter—cutting through the hype to find real value. And the best part? You don’t have to go at it alone—tools can do the heavy lifting, as we’ll explore later.
Quick Tip: Want to test a stock right now? Get a free stock analysis and see what’s really driving its price—no guesswork needed. Click here to start.
Fundamental vs. Technical Analysis
Let’s break it down: fundamental and technical analysis are the yin and yang of stock evaluation. Knowing both—and how they fit together—can give you a serious edge.
- Fundamental Analysis: This is about getting under the hood of a company. You’re looking at balance sheets, income statements, and metrics like price-to-earnings (P/E) ratios or dividend yields. It’s asking, Is this company solid? For example, if a tech firm’s revenue is skyrocketing but its debt’s out of control, fundamental analysis flags the risk. It’s perfect for long-term investors hunting undervalued gems.
- Technical Analysis: Here, it’s all about the charts. You’re studying price trends, volume, and indicators like moving averages or Relative Strength Index (RSI) to spot patterns. It’s less about the company and more about market behavior—great for short-term traders timing entries and exits. Think of NVIDIA’s (NVDA) 2024 premarket jump after earnings—technical traders saw the gap and rode the wave.
Which is better? That depends on you. Long-term investors lean on fundamentals to build wealth over decades. Swing traders thrive on technicals to catch quick moves. But here’s the kicker: the smartest investors blend both. Why settle for half the picture when you can see the whole canvas?
Thought Starter: Imagine analyzing Tesla—fundamentals might show its growth potential, while technicals reveal if it’s overbought. How would you weigh the two? Tools like VectorVest can merge them seamlessly—click here for a free stock analysis of TSLA.
Best Tools for Stock Analysis
Self-directed investing means you’re in the driver’s seat—but you don’t have to navigate blind. The right tools can turn overwhelming data into clear insights. Here’s what’s worth your time:
- Stock Screeners: Filter thousands of stocks by criteria like P/E ratio, volume, or sector. VectorVest’s Stock Screener, for instance, can pinpoint top performers in seconds.
- Charting Platforms: Visualize price trends with tools like VectorVest—great for technical traders eyeing support and resistance levels.
- Financial Data Sites: Yahoo Finance or Morningstar offer free fundamentals—think earnings reports or debt ratios—but lack the speed of integrated systems.
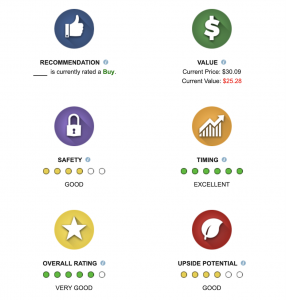
- VectorVest’s All-in-One Power: Why juggle platforms? VectorVest combines fundamental and technical analysis into one dashboard, rating stocks on Value, Safety, and Timing (VST). It’s a complete toolkit for spotting value and timing your moves with confidence.
The twist? The best tools don’t just dump data—they simplify it. A stock might have great earnings, but if its timing’s off, you’re stuck waiting. VectorVest cuts through that noise with actionable clarity.
Try it: Curious about a stock’s fundamentals or trends? Run a free stock analysis and see the full picture instantly.
How VectorVest Simplifies the Process
Stock analysis can feel like a second job—hours poring over reports, charts, and news. VectorVest changes that. It’s built for investors who want results, not headaches. Here’s how it streamlines your game:
- VST Ratings: Forget juggling metrics. VectorVest’s Value, Safety, and Timing (VST) system boils down hundreds of data points into one score. High VST? It’s a contender. Low? Maybe pass. It’s fundamental and technical analysis, distilled.
- Market Timing: Timing’s everything. VectorVest’s Market Timing Gauge tracks broader trends, helping you decide when to dive in or hold back—no crystal ball required. Unlike others, VectorVest provides actionable guidance.
- Less Guesswork: No more endless research. Plug in a ticker, get a clear snapshot—value, safety, timing, upside potential, overall rating—and a recommendation to buy, sell, or hold.
Take Palantir (PLTR) in March 2025: it gaps up premarket after stellar earnings. Fundamentals reveal robust growth, but technicals suggest overbought signals. VectorVest’s VST weaves it into one clear picture, letting you weigh your options. You’re not guessing—you’re informed.
Take Your Stock Analysis to the Next Level
Mastering stock analysis isn’t about memorizing formulas—it’s about having the right framework and tools to act with confidence. Whether you’re digging into fundamentals, charting technicals, or blending both, VectorVest puts it all at your fingertips. From VST ratings to market timing insights, it’s the edge investors need to consistently outperform the S&P 500.
Ready to try it? Analyze any stock for free with VectorVest and uncover what’s driving its potential. Click here for your free analysis. Want more? Test-drive VectorVest’s full platform with a trial and see why it’s trusted by thousands to simplify stock analysis. Start your trial now.
The market’s waiting—who’s in control, you or the chaos?


Leave A Comment