
Written by: John LinDahl
There are many myths about options being risky. While risk is inherent in any investment, options, when used correctly, can mitigate risk, and increase profit. Have you ever bought a stock because you thought it was going to go up, but instead it went up a little, down a little, and moved sideways? This has happened to most of us at some time or another and It can be frustrating as our assets are tied up in the purchase of a stock that is not moving the way we anticipated.
What if we could describe a method to still profit in these instances? What if there was a methodology that we could employ to buy a stock, hold it for a year, and sell it at the same price, yet show a substantial profit?
Today, we are going to demonstrate the power of using options coupled with three technical indicators, serving as triggers. We will show how this allows us to lower our cost-basis on a stock such that even if we bought and sold it at the same price, our cost-basis on the purchase would be lowered and we would realize a profit.
The two types of options we will use are call options and put options. A call option can be purchased if you are bullish on an equity and sold if you are bearish. Similarly, a put option can be purchased if you are bearish on an equity and sold if you are bullish. The acronyms BTO (Buy to Open) and STC (Sell to Close) represent the actions we are taking in buying and selling the options.
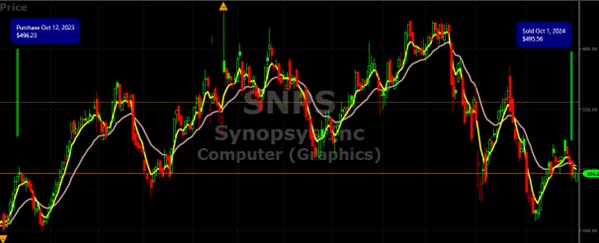
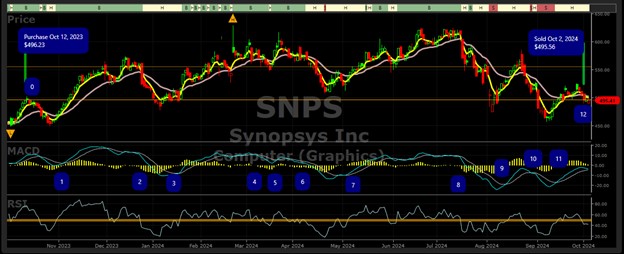
Figure 1 illustrates the price action on Synopsis Inc. (SNPS) over the last year. The stock was purchased on October 12, 2023, for $496.23 per share and sold on October 1, 2024, for $495.56. This would indicate a small loss of $0.76 a share but by using the power of options we lowered our cost basis to $360.65 and realized a profit of 27% over a one-year period.
The key to success is knowing when to buy and sell the call and put options. To assist us in this we will use three technical indicators.
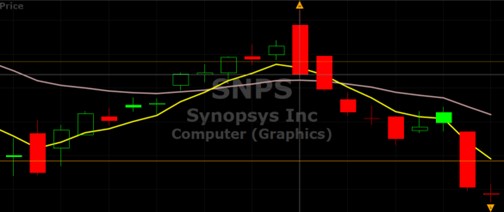
EMA Crossover – Exponential moving averages differ from moving averages by placing a greater emphasis on the more recent prices, thus providing more weight in the nearer term. We are using the 5-day EMA and the 20-day EMA and are looking for crossovers of these two lines in the graphs. A bullish signal occurs when the 5-day EMA crosses above the 20-day EMA and a bearish signal occurs when it crosses below. Figure 2 illustrates bullish and bearish EMA crossovers. The crossovers are recognized by the yellow line (5-day EMA) crossing above and below the purple line (20-day EMA).
MACD – Moving average convergence/divergence (MACD) is a momentum indicator that identifies bullish, bearish, and stagnant trends that allow a trader to find entry and exit points for buying and selling. identify price trends, measure trend momentum, and identify entry points for buying or selling. The indicator is derived by subtracting the 26-period EMA from the 12 period EMA and looking for crossovers of that difference with the 9-day EMA line. Figure 3 illustrates the blue line crossing below the grey line (Opportunity 2), indicating a bearish condition and the blue line crossing above the grey line (Opportunity 3) indicating a bullish condition.
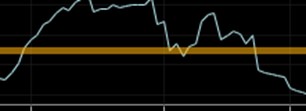
RSI – Relative Strength Index (RSI) measures the speed and magnitude of the recent price changes in a stock. This allows us to determine overbought and oversold conditions in the stock and identify potential reversals in the trend. Figure 4 illustrates the blue line crossing over the gold line indicating a bullish condition and the blue line crossing below the gold line indicating a bearish condition.
While any of these signals are standalone bullish or bearish indicators, the power of this methodology is finding opportunities where all three of them occur at the same time or within a few days of each other. Figure 5 depicts the purchase and sale of the SNPS stock (Opportunities 0 and 12) along with the 11 opportunities to buy and sell the calls and puts. The blue circles with the numbered opportunity represent the points in time where all three indicators are triggering a trade where we will buy and sell calls and puts depending on which direction the crossovers move. These opportunities are detailed in Table 1.
The steps to implement this strategy are:
- Set up a graph on the stock and synchronize up the three indicators with the price action
- Identify the trading opportunities based on the simultaneous crossovers of the three indicators
- Enter bullish trades (BTO Calls and STC Puts) on crossovers above the signal
- Enter bearish trades (BTO Puts and STC Calls) on crossovers below the signal
Table 1 delineates the trades that were made on SNPS and how they lowered the cost basis.
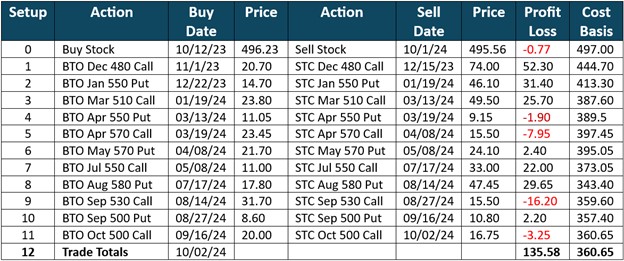
By using this methodology, we were able to lower our cost basis and provide a 27% Return on Investment (ROI) as illustrated by the results in Table 1. There are many reasons people want to hold on to stocks including long-term outlooks, they might be the company you work at, or there might be emotional reasons such as a relative gifted the stock to you. Regardless of your reason, this strategy provides a solution to use the “Power of Options” to drive a profitable return when the trend is stagnant or bearish.


Want These Types of Insights at Your Fingertips so You Can Win More Trades?
Use VectorVest to analyze any stock free. VectorVest is the only stock analysis tool and portfolio management system that analyzes, ranks and graphs over 18,000 stocks each day for value, safety, and timing and gives a clear buy, sell or hold rating on every stock, every day.
Before you invest, check VectorVest! Click here to ANALYZE ANY STOCK FREE and see our system in action!


Leave A Comment