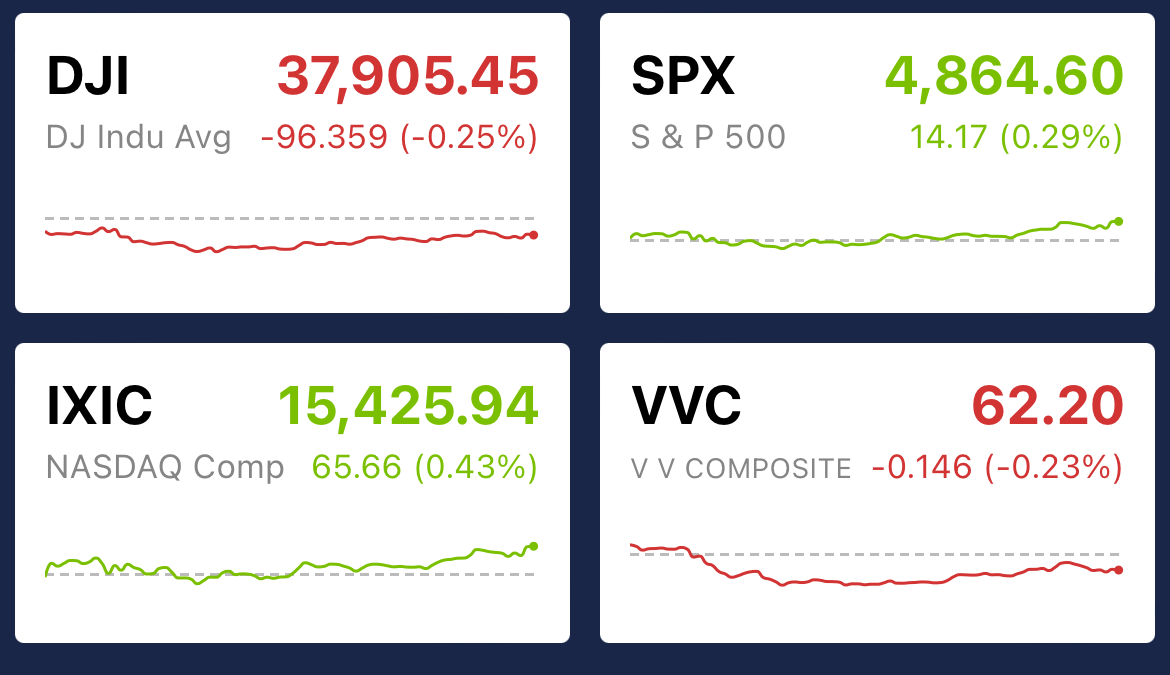
Treasury yields were supported by another positive US bill auction with the Jan 23rd results. After a tumultuous year, the bond market consistently shows strength with the results of the 52-week bill auction and the 2-year note auction. Although it’s not hitting every news headline, bond auctions are a low-risk investment, so no news is often good news, which correlates to an underlying stabilizer for the market. Yesterday was a mixed bag for the market, with companies releasing earnings reports, the S&P and Nasdaq rising, and the Dow and VV composite falling. So, how does the bond market play a role in stabilizing the market? Let’s dive into it!
What is the treasury yield?
Treasury yields represent the effective annual interest rate the U.S. government pays on its debt obligations. Put simply, the US is in debt and sells Treasury bonds to raise capital to pay off that debt, allowing analysis of how the country is handling debt. How it works is simple: When bond yields are low, prices are high, and when bond yields are high, prices are low. It is an interdependent relationship, and these yields are crucial for understanding government borrowing costs, investor returns on government securities, and the broader impact on economic conditions and interest rates in various sectors.
Treasury yields and prices have that interdependent relationship; each type of security has its unique yield reflecting its market price. Treasury securities come in three main types:
- Bonds: (T-bonds) with 20-30 year maturities
- Notes: (T-notes) with 1-10 year maturities
- Bills: (T-bills) maturing within a year
The yield is determined by investors lending money to the government in exchange for interest payments (coupons) and principal repayment. Supply and demand set these yields, with auctions establishing initial rates based on minimum yield bids. Post-auction market value changes affect yields inversely.
The Federal Reserve’s monetary policy also impacts Treasury yields, especially with short-term maturities. Longer-term yields respond more to long-term economic expectations. Typically, longer maturities yield more due to greater risk exposure, but yield curves can invert (short-term yields exceed long-term ones) before recessions, reflecting economic slowdown expectations.
If you take anything away, Treasury yields are a low-risk investment that often goes unnoticed but heavily influences investment rates and is reliable for economic indicators. Although the amount of debt being paid off is high, the market is calm for Treasury yields.
What are the most recent results?
For January 23rd, there were two noticeable auctions: the 52-week bill and the 2-year note. The 52-week bill sold $46 billion in the auction, with a yield of 4.570% and the prior yield being 4.595%. The 4.570% yield is what buyers will get on the maturity date, which is lower than the previous yield, indicating the price went up, which means demand went up for that particular bill. It can be noted that the yield rate has been declining for the past six months, indicating higher and consistent demand, which is the backbone of the economy.
For the 2-year note auction, it sold $60 billion with a yield of 4.365%, with the prior being 4.314%. Even though the yield of 4.365% for the most recent auction is slightly higher than the prior of 4.314%, the trend for the 52-week bill has remained parallel for the 2-year notes. This means that despite this one auction, declining yield rates have been demonstrating demand for the last six months. These consistent numbers support the increase in bill auctions and boost the economy.
Keeping these other indicators in mind as you continue to invest in the market can provide insight into the market’s stability. Still, the best way to invest is to stay informed on individual stocks through VectorVest. VectorVest helps navigate these fluctuations by offering data-driven recommendations on potential investments and buy timing. Regardless of the Treasury yield of auction results, the market presents opportunities for those equipped with the right tools. VectorVest can be your guide, providing insights into market sentiment and helping you make informed investment decisions. Try VectorVest today and discover how it can empower you to navigate complex market dynamics.
Want These Types of Insights at Your Fingertips so You Can Win More Trades?
Use VectorVest to Analyze any stock free. VectorVest is the only stock analysis tool and portfolio management system that analyzes, ranks and graphs over 18,000 stocks each day for value, safety, and timing and gives a clear buy, sell or hold rating on every stock, every day.
Before you invest, check VectorVest! Click here to ANALYZE ANY STOCK FREE and see our system in action.
DISCLAIMER: VectorVest is licensed by VectorVest, Inc., and is protected by United States copyright laws and international treaty provisions. At VectorVest, we are dedicated to providing valuable insights and information to assist you in your investment decisions. However, it's vital to acknowledge the inherent risks associated with stock investments and trading in the financial markets. You should be aware of the risks involved in stock investing, and use the material contained herein at your own risk. This material is believed to be reliable, but neither VectorVest, Inc., nor any of its suppliers guarantee its accuracy, completeness or validity, nor are they responsible for any errors or omissions which may have occurred. The analysis, ratings, and/or recommendations made by VectorVest, and/or any of its suppliers do not provide, imply, or otherwise constitute a guarantee of performance. Therefore, it should not be assumed that future results will be profitable or will equal past performance, real, indicated or implied. VectorVest and/or its principals may purchase or sell any of the securities cited herein. VectorVest and the logostyle geometric design are, individually and collectively, service marks owned by VectorVest, Inc. VectorVest is published daily by VectorVest, Inc. 2650 W. Market St., Akron OH 44333 +1 888-658-7638.


Leave A Comment