FTI Consulting (ticker: FCN), based in Washington, D.C., is a pre-eminent consulting firm in the niche field of global business advisory services, It practices its trade using small client teams which makes it unique. It focuses on providing companies with assistance in managing risk, handling multiple types of disputes such as operational, regulatory, legal, and reputational, turnaround and restructuring, and ESG and Sustainability, among others. FTI is a well-known and highly respected firm in its category of about a dozen competing firms. Its 2021 revenues were $2.8 billion, a 13% increase over the prior year. Forbes magazine rated FTI as one of the best management consulting firms for the sixth consecutive year.
Since September 15, 2022, when FCN made its recent low, it has had a stellar run from $153.57 to $172.69 at the close on October 7. This translates into a 12.5% return compared to a 6.1% loss for the VectorVest Composite Average of over 9,100 stocks. Therefore, FTI has shown an excellent positive absolute relative price performance. However, note that FTI has underperformed the S&P 500 Index over most prior years, but since March 2022 it has shown a strong performance, as its earnings continue to advance on a positive slope. That is a good reason to consider this stock for possible purchase. The key is to make sure all the conditions and VectorVest metrics line up to have the wind on your back.
To provide guidance on any stock, VectorVest employs three proven metrics to assess the health of any stock: Relative Value (RV), Relative Safety (RS), and Relative Timing (RT). They are all measured on a scale of 0.00-2.00 – the higher the reading the better, with 2.00 being the maximum. VectorVest combines them into the “VST-Vector” for every stock in the database with its proprietary mathematical formula. Moreover, every stock is given a BUY, SELL or Hold recommendation.
FCN trades an average 50-day daily trading volume of 253,000 shares, so there is adequate liquidity to enter and exit positions. Moreover, 483 institutions hold shares in this company which shows their conviction in its future prospects.
With clear indicators cast onto a scale of 0.00-2.00, you can pick stocks with the highest VST ratings to win more trades. Here’s the current situation with FCN:
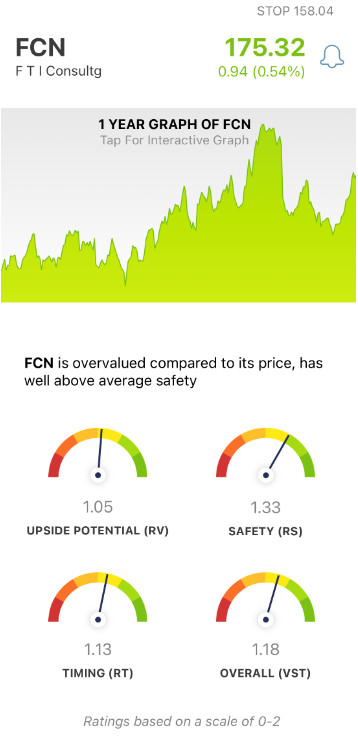
- Fair Upside Potential: The RV rating focuses on a stock’s long-term three-year price appreciation potential. The current RV rating for FCN is an average of 1.05 – near the 1.00 level on a scale of 0.00-2.00. Moreover, the stock is overvalued at the current price of $175.32 compared to. VectorVest’s current value for the stock is $109.55.
- Good Safety: The RS rating is based on the company’s financial predictability/consistency, business longevity, debt-to-equity ratio, and additional risk parameters, including price volatility. The RS rating of 1.33 is above average, indicating a low risk.
- Fair Timing: Lastly, the RT rating focuses on the price trend over the short, medium, and long-term. The components include price direction, dynamics, and price magnitude of price changes over daily, weekly, quarterly, and yearly comparisons. As the accompanying chart shows, on September 28, FCN pierced its 50-day moving average to the upside and has not looked back. For 2022 year-to-date, it has appreciated 12.6% while the general market has declined between 16% for the Dow-Jones Industrial Average to the negative 32% for the Nasdaq Composite. Further gains to exceed the highs of $190.43 on July 11 are on the radar. And a closing price above that level has no resistance as that was its all-time high.
- Good Comfort Index: This index measures the consistency of a stock’s long-term resistance to severe and lengthy corrections. This index compares the individual stock to the fluctuation of the VectorVest Composite and is measured on a scale of 0 to 2.00. At a level of 1.17, clearly, FCN has an above-average rating.
- Very Good Earnings Growth Rate: FCN’s 15% growth rate is well above average and is measured over a forecasted three-year period. This fundamental factor is calculated in the software so you don’t have to do the work. The chart highlights the uptrending earnings and price movement.
- Good VST Score: The VST Master Indicator ranks over 9,100 stocks from high to low, and brings to the top of the rankings those stocks with the highest VST scores. FCN score is 1.18 and is an example of the value of using the VectorVest analysis software to find above-average stocks.
All things considered, is this a good time to buy FCN? The answer may surprise you. Analyze FTI Consulting stock free to get a clear buy, sell or hold recommendation.
Want These Types of Insights at Your Fingertips so You Can Win More Trades?
Use VectorVest to Analyze any stock free. VectorVest is the only stock analysis tool and portfolio management system that analyzes, ranks and graphs over 18,000 stocks each day for value, safety, and timing and gives a clear buy, sell or hold rating on every stock, every day.
VectorVest advocates buying safe, undervalued stocks, rising in price. As for FCN, it is overvalued with fair upside potential, good safety, and fair timing.
Before you invest, check VectorVest! Click here to ANALYZE ANY STOCK FREE and see our system in action!


Leave A Comment