We witness many companies fall short of expectations in the 2nd quarter as more and more reports are starting to funnel in. However, one company that exceeded expectations with ease was Okta. So – why is the company’s stock down over 30% so far today? And does the VectorVest System rate it? We’ll explore this in-depth down below.
Okta, a company that specializes in cybersecurity, helps businesses identify and authenticate users online. In the second quarter of 2022 Okta reported revenue of $452 million – a gain of 43% year over year. This revenue figure came in $22 million higher than analysts were expecting.
However, that’s really where the good news ends for Okta. They still reported an adjusted loss for the quarter of 10 cents per share. The cause for this was weakening demand as a result of the overall economy. Buyers are more cautious about their decisions – and this has lengthened the sales cycle dramatically. Moreover, the cybersecurity firm admits that they’ve struggled to integrate their latest acquisition – Auth0 – into their business. There has been a difficulty for Auth0 reps to acclimate to a different environment – and as a result, Okta has had to spend more time and resources getting up to speed and rehiring than anticipated.
But here’s the big reason this stock dropped from $92/share to $61/share overnight and investors are selling off their positions: management has suggested that they’ll need to reevaluate their long term projections. Okta was originally shooting for a $4 billion revenue target in 2026. But CEO Todd McKinnon stressed that long-term guidance would be a point of discussion on the next earnings call – while suggesting that the company may need to take a step back from that revenue target.
Now – there is reason to believe that this response to Okta earnings is an overreaction in the market. In looking at the overall market sentiment today, we can see that the market is as bearish as it gets. This could be contributing to the panic selling we are seeing not just of Okta – but many other stocks as well. However, while we do believe that the $30/share and counting drop we’re seeing is an over-the-top response, our stock forecasting system has NOT rated it a buy since February of 2021. Here’s why:
3 Reasons Not to Buy OKTA – Based on Objective Fundamental and Technical Analysis
Our stock analysis software eliminates emotion & uncertainty from your investment strategy by simplifying analysis into three simple ratings: Relative Value (RV), Relative Safety (RS), and Relative Timing (RT). These ratings provide investors with everything they need to know about a stock at a glance – ranked on a scale of 0.00-2.00, with 1.00 being the average. These three ratings make up the overall VST rating a stock is given – and dictate whether it’s rated a buy, sell, or hold. And right now, Okta is performing below average in each rating:
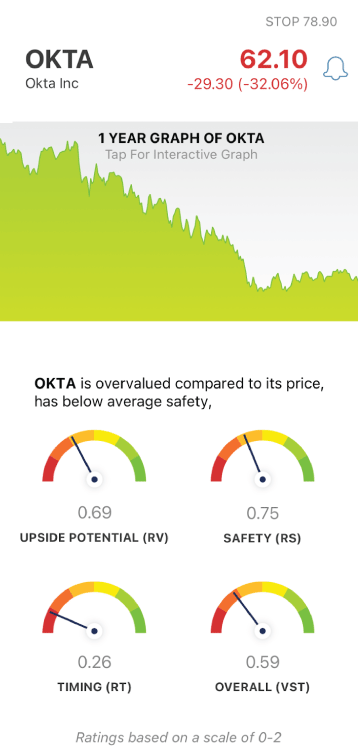
- Poor upside potential: The RV rating is an indicator of long-term price appreciation potential. And for OKTA, the upside potential projected up to 3 years out is poor at 0.69. Moreover, OKTA is still significantly overvalued at its current price of $62/share – our system shows an intrinsic value of just $30/share.
- Poor safety: VectorVest uses RS as an indicator of risk. This rating is calculated from an analysis of the consistency/predictability of a company’s financial performance, its business longevity, and other factors. As for OKTA, the RS rating of 0.75 is poor.
- Very poor timing: Finally, the RT rating grants investors insights into the price trend of a stock. It takes into account the direction, magnitude, and dynamics of a stock’s price movement. When an RT rating exceeds 1.00, it suggests a positive price trend. The opposite is true when an RT rating falls below 1.00 – and in the case of Okta, there is a very negative price trend which has earned an RT rating of 0.26. Moreover, it shows a very poor comfort index of 0.34 – suggesting an inability to withstand lengthy or severe price declines.
All this considered, OKTA has an overall VST Rating of 0.59 , which is poor on a scale of 0.00 to 2.00. Click here for the official VectorVest Buy, Sell or Hold rating.

Want These Types of Insights at Your Fingertips so You Can Win More Trades?
Use VectorVest to Analyze any stock free. VectorVest is the only stock analysis tool and portfolio management system that analyzes, ranks and graphs over 18,000 stocks each day for value, safety, and timing and gives a clear buy, sell or hold rating on every stock, every day.
VectorVest advocates buying safe, undervalued stocks, rising in price. OKTA fails to meet any of these criteria – it’s not safe, it’s overvalued, and it has a negative trend pushing its price down further and further.
Before you invest, check VectorVest! Click here to ANALYZE ANY STOCK FREE and see our system in action!


Leave A Comment