Written By John Lindahl
Options trading strategies provide significant advantages for traders by reducing risk, lowering cost, providing flexibility to meet changing market trends, and enhancing profitability. One such strategy is the use of “Spreads”.
What is a Spread
Spreads are trading strategies that combine the simultaneous buying and selling of options contracts typically at different strike prices or different expiration dates. It combines two or more contracts that when bought and sold simultaneously, create a position that has a quantifiable risk and reward. This allows traders to lower their cost basis, while taking advantage of the overall price movement.
The main types of spreads that are used are categorized as a) Vertical Spreads, b) Horizontal Spreads, and c) Diagonal Spreads. Each of these strategies has specific uses and take advantage of different market conditions.
The focus of this article will be on Vertical Spreads. We will explain the four different types of vertical spreads, discuss the types of markets they work well in, and what their risk and reward characteristics are.
Vertical Spreads
When purchasing a vertical spread, a trader is purchasing and selling options on the same equity that have different strike prices with the same expiration date. This strategy can be used in bullish, bearish, and stagnant markets and the trades can be credit or debit trades. A credit trade involves selling the spread and a debit trade involves buying the spread. This will become more obvious when looking at the trade characteristics of the four types of Vertical Spreads that are used.
As we move forward in this discussion, it is important to understand a key element of these strategies pertaining to the cost of options. In the Money (ITM) strike prices have the highest premium cost. This is followed by At the Money (ATM) strike prices (medium cost), and Out of Money (OTM) strike prices have the lowest premium costs.
1. Bull Call Spread (Debit Trade)
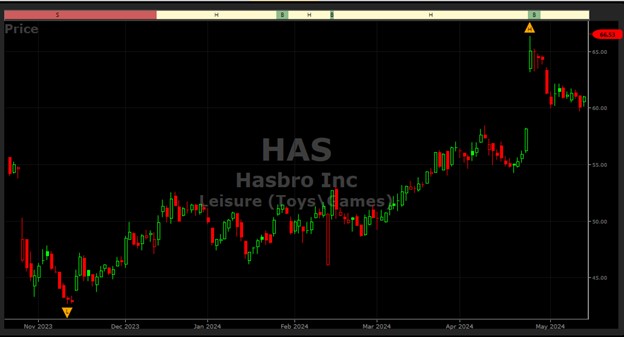
A Debit Bull Call trade is used when the forecast for the equity is bullish, slightly bullish, or stagnant. This trade is constructed by Buying to Open (BTO) a long call at a lower strike price for a debit and Selling to Open (STO) a short call at a higher strike price for a credit. Since the cost of buying the long call at a lower strike price is higher than the sale of the short call at the higher strike price, the trade will still be a net debit, however the credit from the sale of the short call reduces the cost basis for the trade and thus lowers the overall risk. At the same time, this type of structure also caps our maximum reward. As an example, Figure 1 illustrates the price action for Hasbro Inc. and indicates a bullish to slightly bullish market condition.
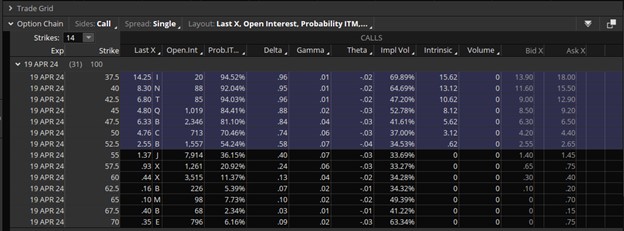
Figure 2 illustrates the option chain on March 19th for the July 19 Expiration of the Hasbro options. The option chain is where the cost of the options is listed.
On March 19, 2024, Hasbro was priced at $52.63. We opened the following Bull Call Position:
Entry Conditions
BTO – July 19 $52.5 Call @ $2.60
STO – July 19 $55 Call @ $1.40
Net Debit – 2.60 – 1.40 = $1.20
Max Risk = Net Debit = $1.20
Max Profit = The difference in the two strikes minus the Net Debit at expiration = 2.50 – 1.20 = $1.30
ROI = Profit/Net Debit = 1.3/1.2 = 108% return in 120 days!!
2. Bear Put Spread (Debit Trade)
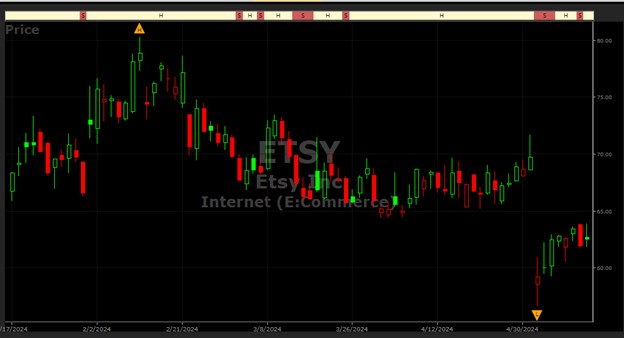
The Bear Put is also a debit trade and is exercised when the expectation for the equity is bearish. This trade is constructed by Buying to Open (BTO) a long put at a higher strike price for a debit and Selling to Open (STO) a short put at a lower strike price for a credit. Since the cost of buying the long put at a higher strike price is higher than the sale of the short call at the lower strike price, the trade will still be a net debit, however the credit from the sale of the short call reduces the cost basis for the trade and thus lowers the overall risk. At the same time, this type of structure also caps our maximum reward. The maximum loss is limited to the net debit of the trade and maximum profit occurs when the stock price declines below the short put strike. Figure 3 illustrates the price action for ETSY. Based on the price action, we clearly see that we are in a bearish trend.
Figure 3. Bearish ETSY Price Action
On May 20th, ETSY closed at $63.80. We entered the following trade that day.
BTO – July 19 60 Put @ $1.85
STO – July 19 55 Put @ $0.70
Max Risk = Net Debit = $1.15
Max Profit at Expiration if ETSY goes below the short put strike = $3.85
ROI = 3.85/1.15 = 376% in 60 days
3. Bear Call Spread (Credit Trade)
The Bear Call is a credit trade and like the Bear Put debit trade it can be executed in a bearish trend, a stagnant trend, and a slightly bullish trend (if Short Call remains out of the money). Since it works in multiple trends, it is used quite frequently. On May 20th had we elected to execute a Bear Call (credit) trade on ETSY in lieu of the Bear Put (Debit) trade the following conditions would have governed our trade
STO June 21 65 Call @ $2.25
BTO June 21 70 Call @ $0.75
Net Credit = Max Profit = 2.25 – 0.75 = $1.50
Max Loss = The difference in Strikes minus the Net Credit = 5 – 1.50 = $3.50
ROI = $1.50/$3.50 = 43% in 30 days
4. Bull Put (Credit Trade)
A bull put is a great trade to execute when you are bullish but are concerned that the equity might not go higher in the near term. This trade can work in a bullish, stagnant, and slightly bearish trend. It involves selling a short put at a higher strike price and buying a long put at a lower strike price to limit risk. The expectation is that the price will stay above the short put strike, the options will expire worthless, and you keep the premium you brought in. The short put is closer to the money and thus brings in a higher premium than the long put. The short put is usually placed at a strike price that is below the current stock price.
Figure 1 illustrates the price action for Hasbro. Had we opened a Bull Put versus the Bull Call trade on March 19th, the following conditions would have existed:
STO April 19 52.5 Put @ $1.20
BTO April 19 47.5 Put @ $0.25
Max Profit = Net Credit = $0.95
Max Loss = Difference in the Spreads minus the Net Credit = 5 – 0.95 = 4.05
ROI = 0.95/4.05 – 23% in 30 days
As we continue to look at different strategies for trading, the goal is that you will understand all your bullish, bearish, and stagnant strategies and be able to compare them against each other to determine which trade provides you the most confidence when evaluating the risk versus reward. In this article we focused on Vertical Spreads that contained two bullish and two bearish options. Each of them had a different risk, different profit, and different ROI. In the next upcoming article, we will combine the Bull Put and the Bear Call strategies to analyze an Iron Condor strategy that can be used in a stagnant or sideways market.
Want These Types of Insights at Your Fingertips so You Can Win More Trades?
Use VectorVest to analyze any stock free. VectorVest is the only stock analysis tool and portfolio management system that analyzes, ranks and graphs over 18,000 stocks each day for value, safety, and timing and gives a clear buy, sell or hold rating on every stock, every day.
Before you invest, check VectorVest! Click here to ANALYZE ANY STOCK FREE and see our system in action!


Leave A Comment