
Written by: Angela Akers
In last week’s “Special Presentation,” Mr. Steve Chappell discussed and demonstrated the efficacy and effectiveness of the VectorVest RealTime Derby. The Derby analyzes, sorts, ranks and graphs the second-by-second performance of 169 portfolios. It tracks each portfolio’s performance from the current day’s opening bell and displays the results from the previous day’s close or the current day’s open (the choice is yours). It reveals the habits of Aggressive Investors and Traders and shows you what strategies are performing today, ie. Bearish or Bullish.
In Steve’s presentation, he also discussed the different Analysis Modes and ways to look at the Derby Results. The presentation got me curious about how I might use the Derby tool to find the best searches for a longer-term investment outlook. Say I wanted to find the best strategy to use when the Confirmed Call Market Timing System issues an Up signal. My gears started turning…
I started by reviewing the five different Analysis Modes:
Today’s Derby which is the default and shows the current day’s intraday performance for each search analyzed, so that we can see which searches are performing the best today.
Day Trading mode models the performance of each search as if you were day-trading the search, ie. buying all stocks from that search and selling them at the close of the same day.
Buy and Hold mode simulates a Buy and Hold type investment approach, ie. buying all stocks from the search at the start of the date range and selling them at the close of the last day in the date range.
Vary the Start Date mode helps you analyze the grit of each Derby search, allowing you to identify the searches that performed well during a portion of the specified date range, but didn’t perform consistently during the entire date range that was tested vs. searches that were more consistent during the entire date range.
Sliding Window mode provides another way to analyze the rigor of a search, by using a series of buy and hold periods within the specified date range. This will allow you to identify searches that performed well during a specific period, but not consistently across the entire date range vs. searches that were more consistent.
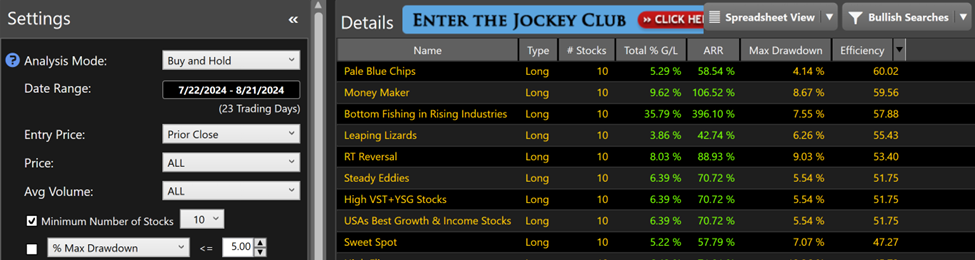
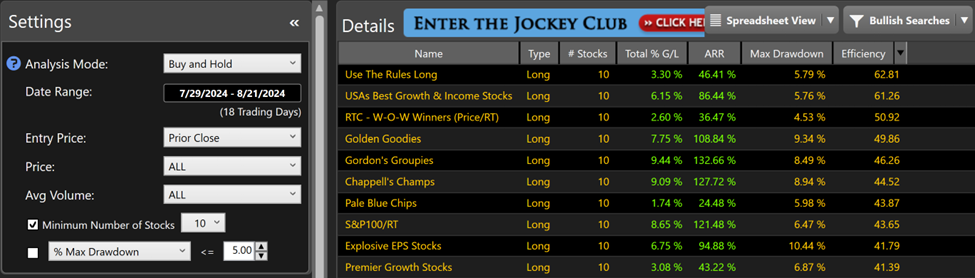
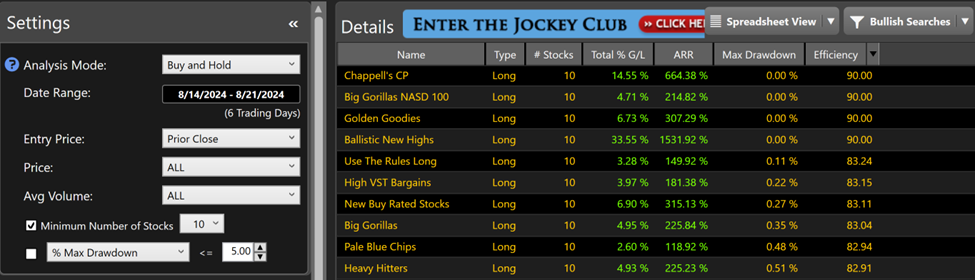
In my humble opinion, the obvious decision was to start my testing with the Buy and Hold Analysis Mode. Secondly, since I was interested in finding longer-term plays, I clicked on the dropdown arrow to the right of All Searches and selected Bullish Searches. I opted to view the searches in the Spreadsheet View as opposed to the Derby View. The Spreadsheet View gives me the ability to clearly see the Efficiency Factor. The Efficiency Factor is an important ratio for me because that is how I would sort my results. The Efficiency Factor is a unique proprietary calculation within the Derby that combines the Percent Winning Days, the Percent Winning Trades and Maximum Drawdown Percentage into a single ratio. Couldn’t ask for more if you’re looking for the best performing strategies.
I thought this setup would give me a good chance of success. Setting out to test that theory, I looked at three different time periods:
July 22, 2024 – August 21, 2024: This would give me the best performing strategies in the month leading up to the Confirmed Up Call.
July 29, 2024 – August 21, 2024: Because why not test a random date.
August 14, 2024 – August 21, 2024: This would give me the best performing strategies in the week leading up to the Confirmed Up Call.
I then clicked on the UniSearch tab to complete my testing. I tested the top 10 stocks (with the exception of the Golden Goodies search which only returned 7 stocks at the time of testing) from the top 3 strategies from each time period above. I ran the search on August 21, 2024 (the C/Up signal) and QuickTested through yesterday’s close. Here are the results:
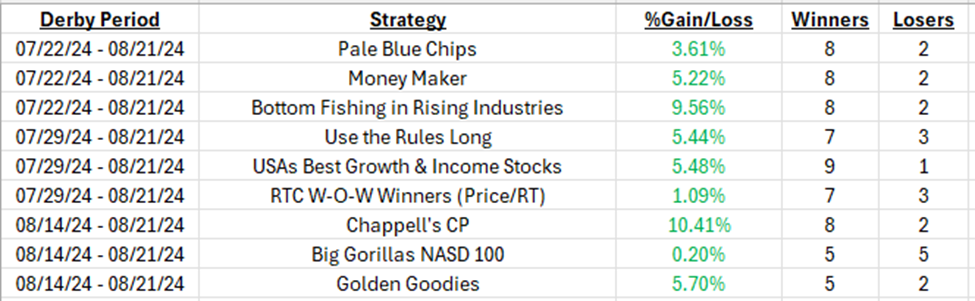
During the same time period, the market, as represented by the Price of the VVC, gained 2.74%. Therefore, seven of the nine tests above beat the results. Not too shabby. This definitely encourages me to keep observing and testing over the next several months to see if this performance holds up for a Prudent investor such as myself. Since the lookback period of the Derby is only 3 months (due to all the analysis that goes on inside the tool), I will be forward testing this idea and will report on my findings in the future.
In the meantime, I want to send a big THANK YOU to Steve and the VectorVest RealTime Derby for motivating me to try something different this last week. I realized that The Derby isn’t just a Traders’ Toolbox , it’s also an Investors’ Inspiration.
Don’t have the Derby? There is still time to try it for FREE! Please CLICK HERE for a FREE 30-Day Trial to the VectorVest RealTime Derby and the Jockey Club.
Make sure you watch tonight’s “Special Presentation” where Mr. Todd Shaffer will demonstrate how the VectorVest Proprietary Market Timing indicators can help you spot market turning points!


Want These Types of Insights at Your Fingertips so You Can Win More Trades?
Use VectorVest to analyze any stock free. VectorVest is the only stock analysis tool and portfolio management system that analyzes, ranks and graphs over 18,000 stocks each day for value, safety, and timing and gives a clear buy, sell or hold rating on every stock, every day.
Before you invest, check VectorVest! Click here to ANALYZE ANY STOCK FREE and see our system in action!


Leave A Comment