After losing its footing to start the week, Nvidia (NVDA) picked right back up where it left off after hours yesterday, soaring on news of another quarter of growth. The AI chip designer grew its top and bottom line, sending shares nearly 15% higher in the past 24 hours.
The company delivered 265% revenue growth, posting $22.1 billion compared to the $20.6 billion analysts were expecting. Earnings impressed as well, with an 804% growth year over year to $5.15 per share. This easily beat out the $4.59 consensus.
Jensen Huang, CEO of Nvidia, says that we’ve reached the tipping point for AI, where demand for its chips is at an all-time high as other companies seek to cash in on the trend.
The company controls as much as 95% of the market for AI chips. Its customers are not only willing to pay a premium but also wait as long as 18 months for the delivery of chips.
The truth is, no other company in the space can hold a candle to the quality of Nvidia’s chips – they allow companies to save time, and in turn, money. Thus, the expensive nature of the Nvidia H100 series (ranging as high as $40k per chip) is a no-brainer investment.
This is why the torrent growth Nvidia has displayed may not be slowing down any time soon. Looking ahead to the current quarter, the company is expecting even faster growth – with a 300% uptick in revenue to $24 billion. Analysts are expecting just $21.6 billion.
All that being said, some analysts believe this level of growth is unsustainable. Many placed a price target of $700 on NVDA – which sits at $776 today post-earnings. This begs the question, is there any room left for investors to buy this stock?
We’ve taken a look through the VectorVest stock analysis software and see 3 reasons to consider picking up more shares of NVDA if you haven’t already.
NVDA Has Excellent Upside Potential, Safety, and Timing

VectorVest is a proprietary stock rating system engineered to save investors time and stress, all while empowering them to win more trades. It’s based on 3 simple ratings: relative value (RV), relative safety (RS), and relative timing (RT).
Each of these ratings sits on a scale of 0.00-2.00 with 1.00 being the average, allowing for quick and easy interpretation. But to make things even easier, you’re offered a clear buy, sell, or hold recommendation for any given stock at any given time based on its overall VST rating. As for NVDA, here’s what we found:
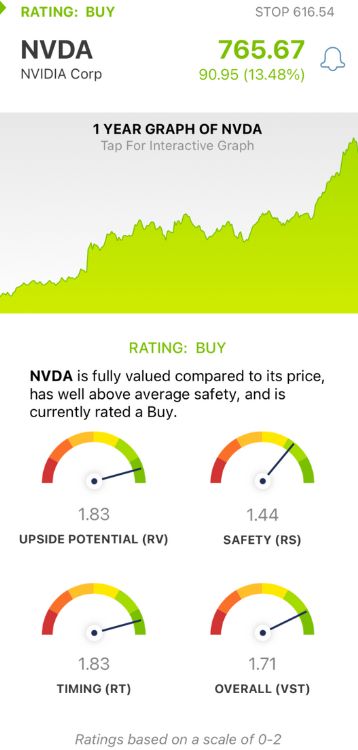
- Excellent Upside Potential: The RV rating compares a stock’s long-term price appreciation potential (forecasted 3 years out), AAA corporate bond rates, and risk. It offers much better insight than a simple comparison of price to value alone. The RV rating of 1.83 is excellent for NVDA.
- Excellent Safety: The RS rating is a risk indicator calculated from a deep analysis of the company’s financial consistency & predictability, debt-to-equity ratio, business longevity, sales volume, price volatility, and other factors. NVDA has an excellent RS rating of 1.44 as well.
- Excellent Timing: The RT rating is based on the direction, dynamics, and magnitude of the stock’s price movement. It’s taken day over day, week over week, quarter over quarter, and year over year. NVDA also has an excellent RT rating of 1.83.
All things considered, the stock has an excellent overall VST rating of 1.71 - and NVDA is rated a buy in the VectorVest system. Don’t miss out on this opportunity - get a free stock analysis today!
Want These Types of Insights at Your Fingertips so You Can Win More Trades?
Use VectorVest to analyze any stock free. VectorVest is the only stock analysis tool and portfolio management system that analyzes, ranks and graphs over 18,000 stocks each day for value, safety, and timing and gives a clear buy, sell or hold rating on every stock, every day.
VectorVest advocates buying safe, undervalued stocks, rising in price. NVDA is up 15% after yet another quarter of impressive growth, defying the doubters and doubling down on more growth in the quarter ahead. The stock has excellent upside potential, safety, and timing.
Before you invest, check VectorVest! Click here to ANALYZE ANY STOCK FREE and see our system in action!


Leave A Comment