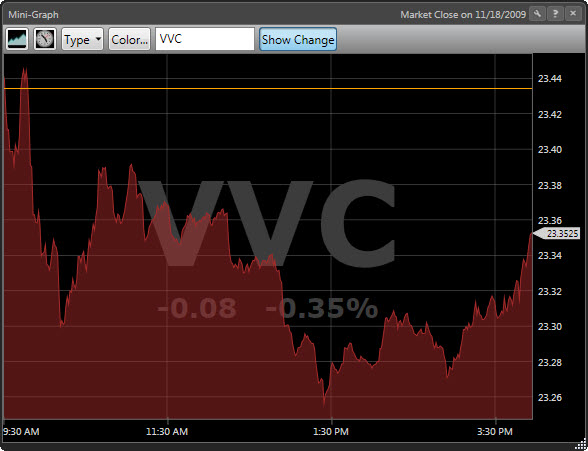
The Standard MiniGraph tracks the price performance of any security, industry, sector or market timing indicator. Stock information will update in RealTime, while group and market timing information updates every five seconds.
This Gadget is customizable. Left-clicking the Settings Icon will display the MiniGraph Toolbar.

Standard MiniGraph Toolbar Settings:
MiniGraph Type: ![]() Click to select the graph type.
Click to select the graph type.
Price Graph: Displays a graph of the price movement for the selected stock, industry, or sector graph.
VVC RT Graph: Displays the movement of the VectorVest Composite's Relative Timing Indicator.
MTI Graph: Displays the movement of the VectorVest Market Timing Indicator.
BSR Graph: Displays the movement of the Buy/Sell Ratio.
Advance/Decline Graph: Displays the movement of advancing stocks versus declining stocks in the VectorVest database .
Time span and Frequency: ![]() Click to select Intraday, End of Day, or Weekly data for the MiniGraph.
Click to select Intraday, End of Day, or Weekly data for the MiniGraph.
Type: Click to select a stock, industry, or sector graph. This selection is only available on price graphs.
Color: Click to choose the color of the MiniGraph .
Selection Box: The selection box allows you to type the ticker symbol of a stock when choosing a stock graph. This box will change to a drop down menu when the industry or sector graph type is selected.
Size: The size menu will allow you to select a small, medium or large graph.
Show Change: The Show Change button displays a watermark for the point or dollar change and percent change of the security.
Previous Close: A horizontal line on the MiniGraph marks the level of the chosen security's previous close.
RealTime Tracker: Located in the top right corner of the MiniGraph. As the cursor is moved along the curve of the graph, the RealTime Tracker will display the time, the level of the security, the point or dollar change, and percent change of the security for each intraday data point. The RealTime Tracker will limit the display to the date and level of the security when viewing End of Day or Weekly data.