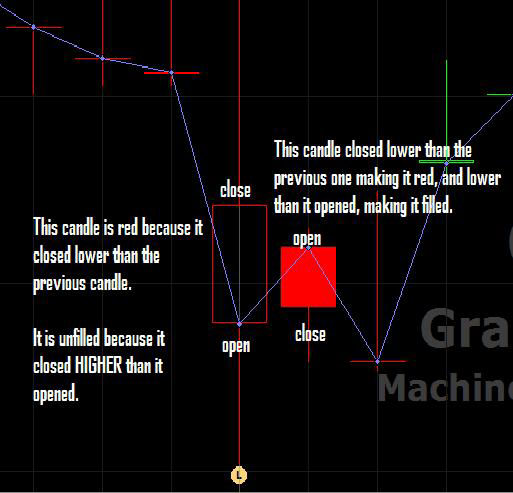

Candlestick charts are the default graph type in VectorVest RealTime, and have the ability to convey much more information about a security's price movement than the standard line graph. Below is a basic explanation of how to interpret RealTime candlesticks.
The color of the candlestick, red or green by default, is determined by where the current candlestick closed in relation to the previous candlestick.
The candlestick will be red if it closes lower that the previous candle's close.
The candlestick will be green if it closes higher that the previous candle's close.
Some candlesticks will be filled (solid), and some will be unfilled (hollow) based on where the current candle closes relative to its open price.
If the candlestick closes lower than it opened the candle will be filled (Tip: Think of the candle falling lower because it's heavy).
If the candlestick closes higher than it opened, the candle will be unfilled.
The purple line shows the open of each candlestick for demonstration.

