|
Summary Analysis - August 2, 2013
FB is overvalued compared to its Price of $37.49 per share, has below average safety, and is currently rated a Buy.
Nobody Analyzes Stocks Like VectorVest
Try VectorVest Risk FREE for as little as $9.95
 
Detailed Analysis
Company Information
Business: Facebook Inc, (FB) Facebook, Inc. (Facebook), incorporated in July 2004, is engaged in building products to create utility for users, developers, and advertisers. People use Facebook to stay connected with their friends and family, to discover what is going on in the world around them, and to share and express what matters to them to the people they care about. Developers can use the Facebook Platform to build applications and Websites that integrate with Facebook to reach its global network of users and to build personalized and social products. Advertisers can engage with more than 900 million monthly active users (MAUs) on Facebook or subsets of its users based on information they have chosen to share with the Company, such as their age, location, gender, or interests. It offers advertisers a combination of reach, relevance, social context and engagement.
Capital Appreciation Analysis
Value: Value is a measure of a stock's current worth. FB has a current Value of $8.23 per share. Therefore, it is overvalued compared to its Price of $29.08 per share. Value is computed from forecasted earnings per share, forecasted earnings growth, profitability, interest, and inflation rates. Value increases when earnings, earnings growth rate and profitability increase, and when interest and inflation rates decrease. VectorVest advocates the purchase of undervalued stocks. At some point in time, a stock's Price and Value always will converge.
RV (Relative Value): RV is an indicator of long-term price appreciation potential. FB has an RV of 0.95, which is fair on a scale of 0.00 to 2.00. This indicator is far superior to a simple comparison of Price and Value because it is computed from an analysis of projected price appreciation three years out, Scotia Capital Incorporated Corporate Long Term Bonds, and risk. RV solves the riddle of whether it is preferable to buy High growth, High P/E stocks, or Low growth, Low P/E stocks. VectorVest favors the purchase of stocks with RV ratings above 1.00.
RS (Relative Safety): RS is an indicator of risk. FB has an RS rating of 0.62, which is poor on a scale of 0.00 to 2.00. RS is computed from an analysis of the consistency and predictability of a company's financial performance, debt to equity ratio, sales volume, business longevity, price volatility and other factors. A stock with an RS rating greater than 1.00 is safer and more predictable than the average stock in the VectorVest database. VectorVest favors the purchase of stocks of companies with consistent, predictable financial performance.
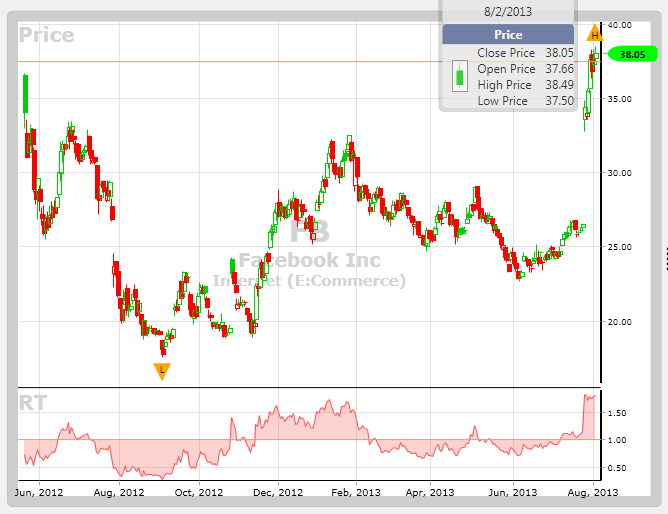
RT (Relative Timing): RT is a fast, smart, accurate indicator of a stock's price trend. FB has a Relative Timing rating of 0.55, which is poor on a scale of 0.00 to 2.00. RT is computed from an analysis of the direction, magnitude, and dynamics of a stock's price movements over one day, one week, one quarter and one year time periods. Once a stock's price has established a strong trend, it is expected to continue in that trend for the short-term. If a trend dissipates, RT will gravitate toward 1.00. RT will explode from bottoms, dive from tops, and reflect changes in price momentum. VectorVest favors the purchase of stocks with RT ratings above 1.00.
VST (VST-Vector): VST is the master indicator for ranking every stock in the VectorVest database. FB has a VST rating of 0.71, which is poor on a scale of 0.00 to 2.00. VST is computed from the square root of a weighted sum of the squares of RV, RS, and RT. Stocks with the highest VST ratings have the best combinations of Value, Safety and Timing. These are the stocks to own for above average, long-term capital appreciation. VectorVest advocates the purchase of safe, undervalued stocks rising in price.
Recommendation (REC): VectorVest gives a Buy, Sell, Hold recommendation on every stock, every day. FB has a Sell recommendation. REC reflects the cumulative effect of all the VectorVest parameters working together. These parameters are designed to help investors buy safe, undervalued stocks rising in price. They also help investors avoid or sell risky, overvalued stocks falling in price. VectorVest recommends that investors buy high VST-Vector, Buy-rated stocks in rising markets.
Stop (Stop-Price): Stop is an indicator of when to sell a long position or cover a short position. FB has a Stop of $34.27 per share. This is $5.19 above FB's last closing Price. A stock's Stop is computed from a 13 week moving average of its closing prices, and is fine-tuned according to the stock's fundamentals. High RV, high RS stocks have lower Stops, and low RV, low RS stocks have higher Stops. In the VectorVest system, a stock gets a 'B' or 'H' recommendation if its Price is above its Stop and an 'S' recommendation if its Price is below its Stop.
GRT (Earnings Growth Rate): GRT reflects a company's one to three year forecasted earnings growth rate in percent per year. FB has a forecasted Earnings Growth Rate of 50.00%, which VectorVest considers to be excellent. GRT is computed from historical, current and forecasted earnings data. It is updated each week for every stock in the VectorVest database. GRT often foretells a stock's future price trend. If a stock's GRT trend is upward, the stock's price will likely rise. If GRT is trending downward, the stock's Price will probably fall. VectorVest favors the purchase of stocks whose GRT is rising and is greater than the sum of current inflation and interest rates.
EPS (Earnings per Share): EPS stands for leading 12 months Earnings Per Share. FB has a forecasted EPS of $0.54 per share. VectorVest determines this forecast from a combination of recent earnings performance and traditional fiscal and/or calendar year earnings forecasts.
PE (Price to Earnings Ratio): P/E is a popular measure of stock valuation which shows the dollars required to buy one dollar of earnings. FB has a PE of 53.85. This ratio may be deemed to be high or low depending upon your frame of reference. The average P/E of all the stocks in the VectorVest database is 38.05. P/E is computed daily using the formula: P/E = Price/EPS.
EY (Earnings Yield): EY reflects earnings per share as a percent of Price. EY is related to P/E via the formula, EY = 100 / (P/E), and may be used in place of P/E as a measure of valuation. EY has the advantages that it is always determinate and can reflect negative earnings. FB has an EY of 1.86% percent. This is below the current average of 2.61% for all the stocks in the VectorVest database. EY equals 100 x (EPS/Price).
GPE (Growth to P/E Ratio): GPE is another popular measure of stock valuation. It compares earnings growth rate to P/E ratio. FB has a GPE rating of 0.94%. High growth stocks are believed to be able to justify high P/E ratios. A stock is commonly considered to be undervalued when GPE is greater than 1.00 and overvalued when GPE is below 1.00. Unfortunately, this rule of thumb does not take into account the effect of interest rates on P/E ratios. The operative GPE ratio of 1.00 is valid when and only when interest rates equal 10%. With long-term interest rates currently at 3.32%, the operative GPE ratio is 0.110224. Therefore, FB may be considered to be undervalued.
Nobody Analyzes Stocks Like VectorVest
Try VectorVest Risk FREE for as little as $9.95
|